Recently, when configuring Linux audit logs, special characters appeared near the end of the Ubuntu system audit logs, causing the logstash grok rule parsing to fail. Copy the log message field to Kibane Grok Debugger for debugging, and it is obvious that the Sample Data audit log has a special color character. If you press Crrl on the keyboard + mouse wheel to zoom in the browser page, you will see two small letters in the color field, namely G and S, and the character cannot be copied alone. However, if you select all, copy and paste them into the code editor, you will see that the special character is displayed as <0x1d>, which belongs to the ASCII character set.
I originally thought that if I copied <0x1d> into the Gork Pattern rule, logstash could parse it normally, so I added the configured grok rule to the kibana Gork Pattern, and the debug log was
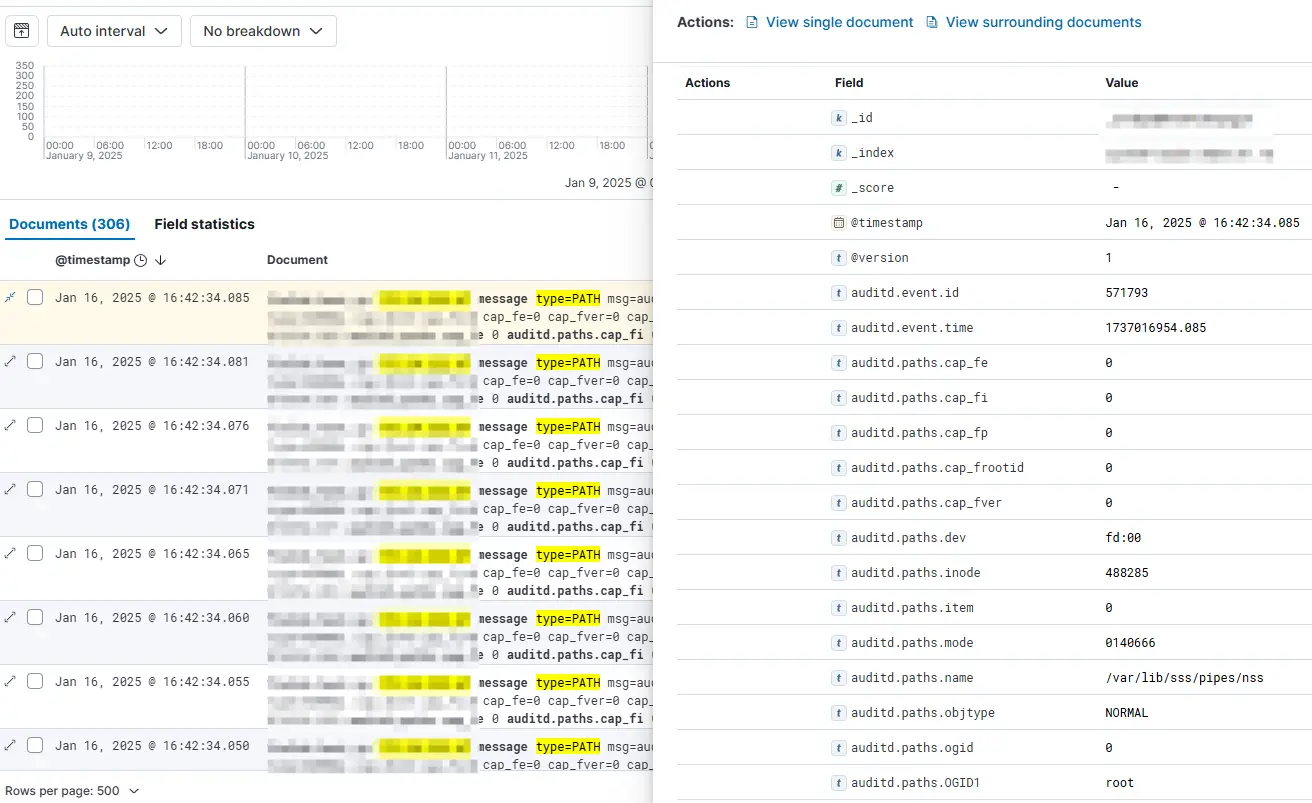
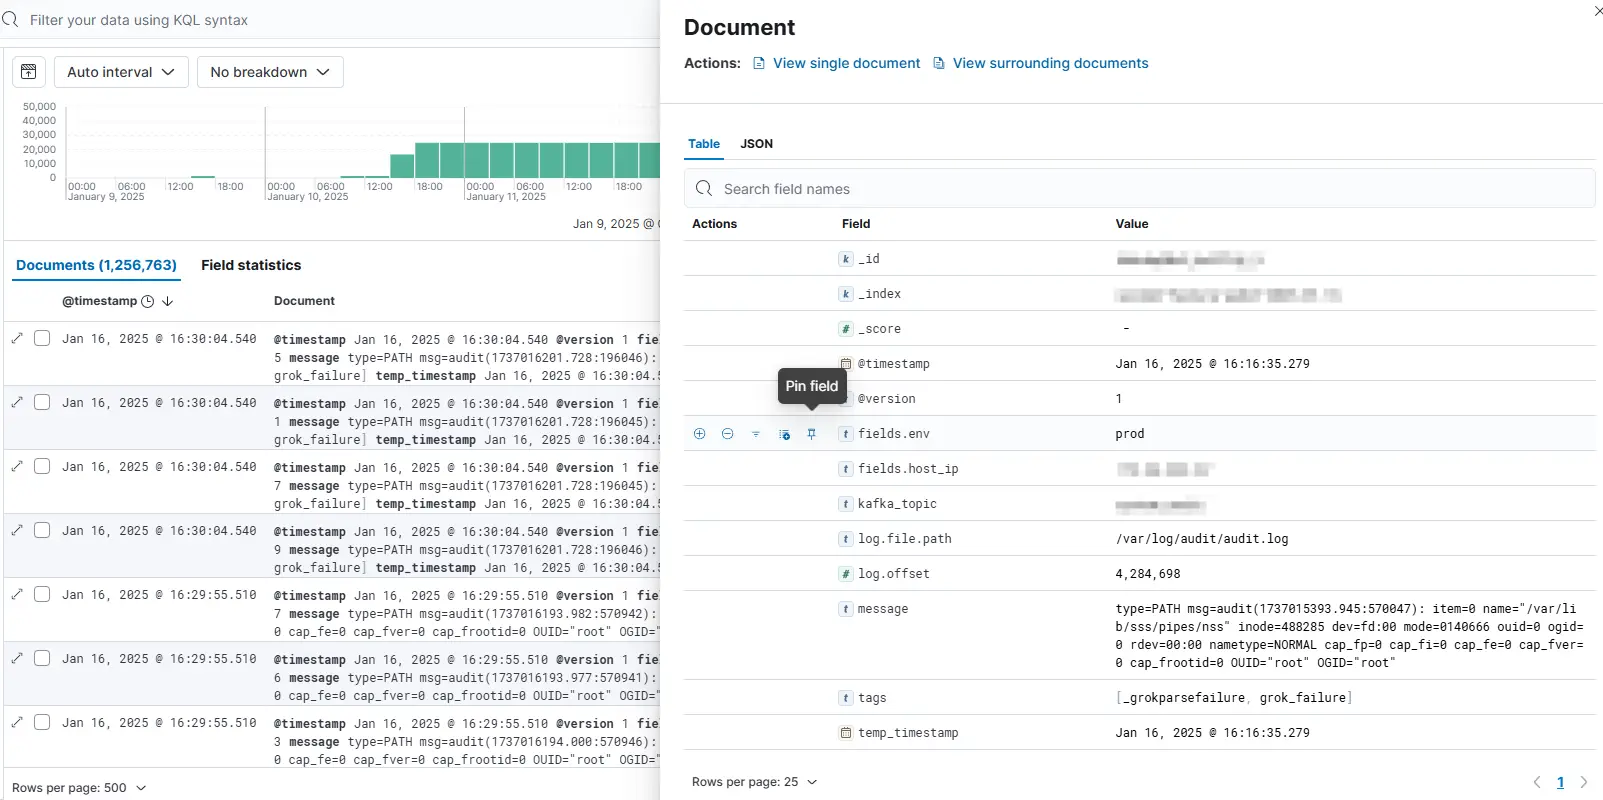
It can parse the log normally, but when it is added to the logstash configuration file, logstash grok does not fail at all after startup, so all such logs fail to be parsed, as shown below:
The final solution is to use regular expressions to match the ASCII character set and delete
filter { grok { match => { "message" => "%{DATA:type}(?:[\x00-\x1F\x7F])*%{DATA:name}" } }}Then modify the logstash configuration file, after automatic reload, observe the latest log, there are no audit logs that failed to parse